Healthier Health Comms with a Wholesome Data Diet
A recipe for brand health in marketing

Going beyond pre-packaged metrics to fulfill the need for insights and business answers
The majority of the data informing health communications is like fast food.
At first glance, it ticks all the boxes. It is easy to get, it is (mostly) affordable, it is filling, and it is predictable. If we go on a steady fast-food diet, though, we quickly realize it leaves us feeling simultaneously bloated and unfulfilled.
Just like us starving for relevant customer insights and being none the wiser about the impact of our programs and campaigns despite having loads of dashboards, reports, and real-time numbers.
The fast-food data diet feasts on averages
Over the past 20 years, platforms have turbo-charged marketing and communications by simplifying content distribution, media buying, communications integration, CRM, and, crucially, tracking engagement. Tracking allows us to measure the results and inform what we do next.
The main issue is that out-of-the-box solutions are built with a one-size-fits-all approach. Even though there’s flexibility in other parts of the system, metrics tend to be standardized. Additionally, the platform’s assumptions are imposed on the metrics we do get.
Going back to our metaphor: a platform might count an ultra-processed patty as protein, whereas we wouldn’t. Additionally, it might inform grams amounts, whereas we might need to know it relative to our daily intake.
In practice, this means we can choose what to look at from a menu of pre-calculated metrics but are not generally allowed to mix and match variables to create custom, business-specific metrics. The upshot is often a feast of sums and averages.
It is not a problem when that is all we need to know. It’s easy enough to track a paper’s downloads and a video’s plays. It gets trickier if you want to know how effective they are at getting the message through and if we’re getting our money’s worth for these assets. And that’s what the most pressing business questions are about. In these cases, sums lack context and averages flatten important differences.
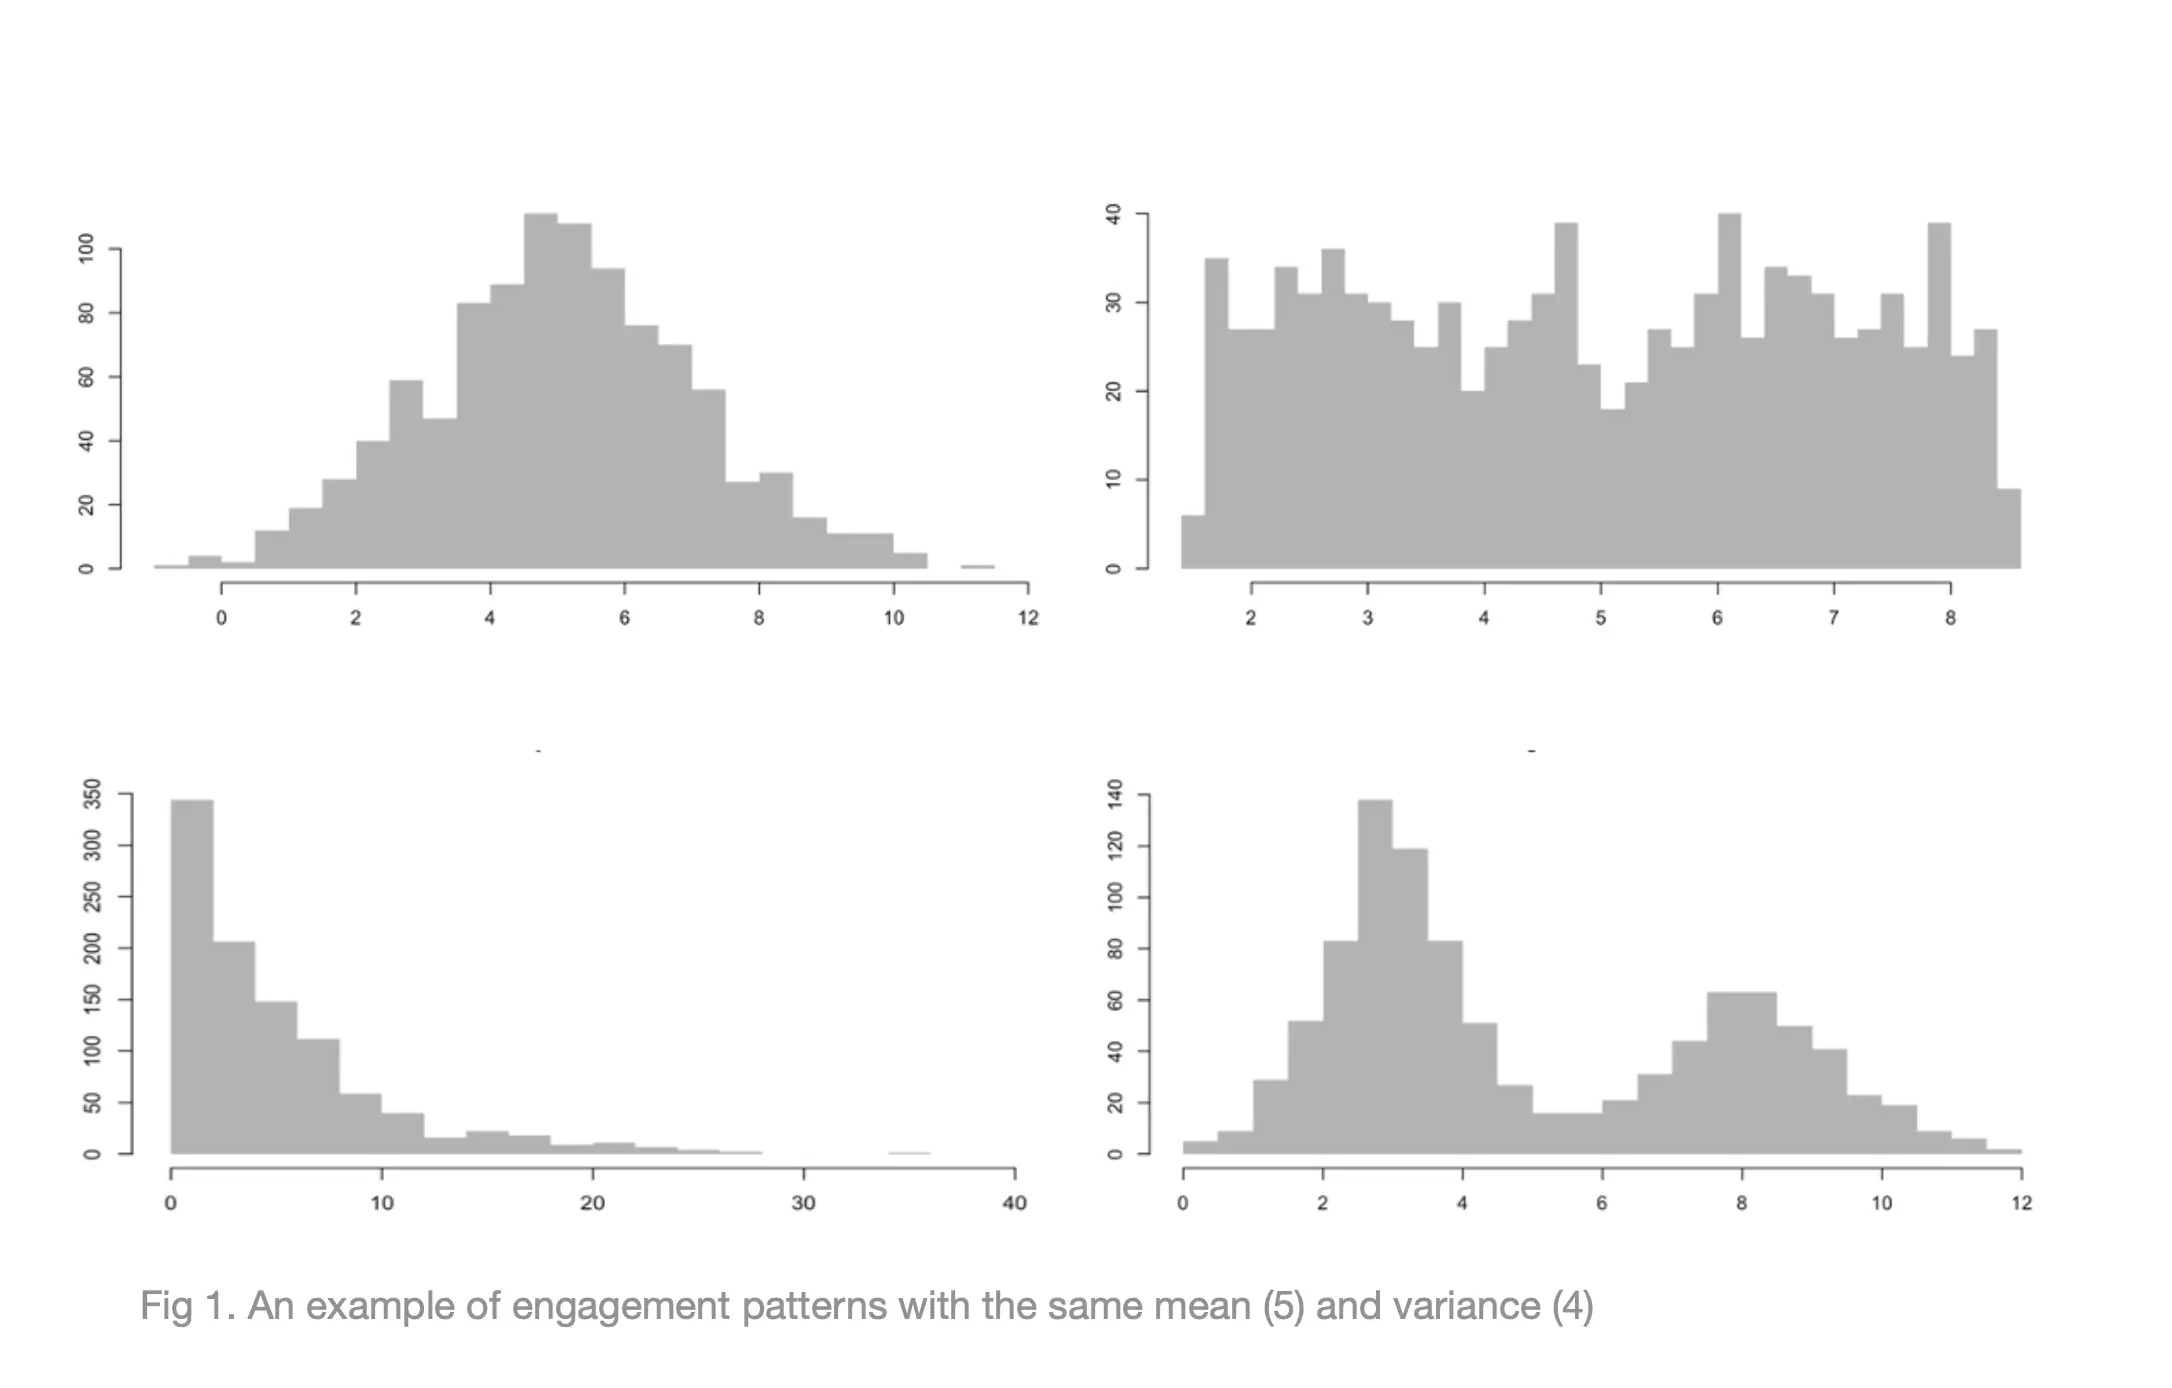
Just imagine we have just launched an online tutorial for a new therapy or a revamped patient support group program. Now look at Figure 1. It shows four different engagement profiles for our initiative.
All of them have the same average and the same variance in engagement. However, just by eyeballing the charts, we know we are not looking at the same thing. The engagement patterns are completely different. They tell different stories, that’s for sure. But are they all equally effective? Or do they simply reflect people’s learning styles or time availability? Do these patterns lead to different outcomes? If so, how many work? Which ones should we watch for and encourage through our channels?
 For these questions, pre-packaged metrics won’t cut it. In other words, that’s when we need to turn to our raw data. They are the ingredients we need to find the recipe that delivers the answers we crave.
Your data recipe book starts with the right ingredients
If we want to be healthy, we know better than to live on fast-food meals. And if we want insights unique to our industry, disease space, or Rx, we must build a healthy, well-balanced data diet.
True nourishment requires paying attention to the ingredients and how they combine into wholesome meals. Game-changing health communications intelligence demands looking beyond pre-packaged metrics, treating raw data as invaluable ingredients, and going back to the fundamentals to find the right way to mix them into a recipe greater than their sum (or average).
I recently worked on an impact measurement project for a digital educational platform. It launched with 25 courses, tools, and other features. Best of all, it was designed to adapt the intervention to each person’s needs. The project sponsors followed the uptake closely: registrations, active users, average courses taken, average time spent on the platform, etc. Despite all that, two years and a couple hundred thousand people later, there was one thing they still didn’t know: was it working?
The catch was that the built-in metrics were not designed to capture engagement patterns across customized journeys, flexible content tracks, and free feature usage. And without that, there was no way of knowing what interventions looked like, let alone if they had any impact on outcomes.
The solution was to get cooking. First, we took inventory through a data audit. The raw data gave us more than 1300 variables of interest. Then, knowing what we had, we identified the most promising ingredients. It was done by reconciling and integrating data on user profiles, interactions, timestamps, and much more at the individual level. A little less than 100 made the cut. Next, we started mixing and matching them to create a base recipe. That resulted in approximately 50 brand-new variables capturing key aspects of users’ engagement trajectory: intensity, consistency, and cadence. The new variables, in turn, went through a process of dimensionality reduction to manage the noise; clustering to group people with similar patterns; and cluster profiling to identify the variables separating one group from the other.

In the end, only a handful of key variables were retained and the procedures were as simple as possible. This ensured they were easy to integrate into the platform’s stack and the governance team’s workflow. In other words, there was a recipe that worked for an average cook in a regular kitchen. Thanks to it, we were able to measure the platform’s impacts on outcomes and the investment’s payoff.
Having your own data-recipe book will make your communications healthier
Going beyond out-of-the-box metrics and getting the right data for our key questions can seem daunting. It’s the kind of work we can quickly think of as a fine-dining data experience: too fancy, too complicated, too expensive.
A balanced data diet, though, is neither about the instant gratification of pre-packaged metrics nor open-ended consultancy data projects. It requires exploration, patience, and diligent work, no question about that. However, when done properly, the new frameworks and metrics become easy to implement, scale quickly, and have far-reaching benefits.
Beyond proving the platform’s impact (and yes, it worked), the project sponsors walked away with a custom-built blueprint of which engagement patterns drive success and which variables to track going forward. It is now being leveraged to both improve the platform, by building the new metrics into it, and to rethink the reporting process and how it informs activations.
Fast-food metrics might get us through a day, but, in the long run, nothing beats the kick of a wholesome data diet.
Paulo Coelho Mendes builds solutions to unlock the power of ‘hard’ and ‘soft’ data, leveraging a mixed background in Sciences and Humanities.

